+0.00m / CONCOURSE
Space analytics
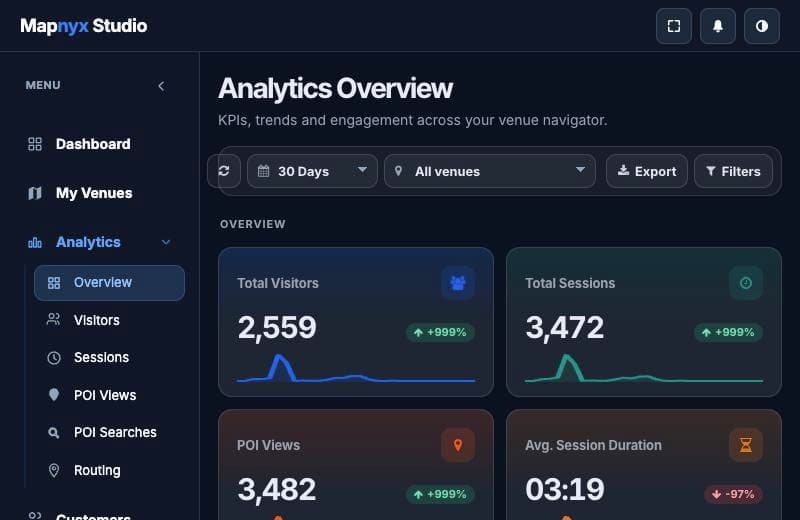
Space analytics measures how a venue is actually used: footfall by zone, movement flows, dwell times, occupancy by hall and hour. Organisers and venue operators use it to price floor space, fix bottlenecks and back decisions with observed behaviour instead of guesses.
Every square metre has a price. Analytics shows which ones earn it.
+0.00m / CONCOURSE
What it does
Footfall by zone
Live and historical counts per hall, corridor and court, from positioning data, sensors or kiosk interactions.
Flow mapping
The routes visitors actually take — and where they jam — drawn on the real floor plan.
Dwell and engagement
How long visitors stay in a sponsor zone; which booths pull traffic and which corners never see it.
Sponsor reporting
Placement impressions and interactions organisers can put in a post-event report with a straight face.
Comparable across events
The same metrics, computed the same way, across every show in the same hall — because the venue is mapped once.
Aggregate by default
People-analytics report aggregates, not individuals. The privacy stance is on the trust page in plain language.
LIVE LAYER
Analytics joined to the live layer answers better questions: not just 'was Hall 2 busy' but 'was Hall 2 busy relative to the booths it sold'.
+0.00m / EXIT
See your venue as your visitors will
Book a walkthrough on a live venue map, or start free with your own floor plan.